
Delaying a Property Purchase in Australia Is No Longer a Passive Decision
- Joean Soliman

- Mar 25
- 3 min read

Delaying a property purchase in Australia is no longer a passive decision — it is an active financial cost. Based on recent growth trends and forward projections, investors waiting on the sidelines are effectively losing between $150 to $650 per week in unrealised capital growth depending on the state.
Across most markets, price growth has already offset borrowing capacity gains from rate cuts, meaning waiting does not improve affordability — it erodes it.
A 12–24 month delay (2024 → 2026) can result in:
$80,000–$220,000+ missed growth
$16,000–$44,000 additional deposit required (20%)
Higher debt exposure despite “waiting for better conditions”
National Overview
Growth Trend Snapshot (Public Estimates – CoreLogic, Domain, KPMG)
Year | National Growth | Median Price (Approx) |
2024 | ~5.5% | $820,000 → $865,000 |
2025 | ~6.0% | $865,000 → $917,000 |
2026 (Forecast) | ~5.0% | $917,000 → $963,000 |
Formula Used:
Annual Growth ($) = Median Price × Growth %
Monthly = Annual ÷ 12
Weekly = Annual ÷ 52
👉 National Weekly Cost of Waiting (2025):≈ $1,050 per week (median level)
State-by-State Breakdown
1. New South Wales (NSW)
Year | Growth | Median Start | Median End | Annual $ Growth |
2024 | 4.0% | $1,200,000 | $1,248,000 | $48,000 |
2025 | 4.5% | $1,248,000 | $1,304,000 | $56,000 |
2026 | 5.0% | $1,304,000 | $1,369,000 | $65,000 |
Weekly Cost (2025): $1,077
2. Victoria (VIC)
Year | Growth | Median Start | Median End | Annual $ Growth |
2024 | 3.0% | $800,000 | $824,000 | $24,000 |
2025 | 3.5% | $824,000 | $853,000 | $29,000 |
2026 | 5.0% | $853,000 | $895,000 | $42,000 |
Weekly Cost (2025): $558
3. Queensland (QLD)
Year | Growth | Median Start | Median End | Annual $ Growth |
2024 | 9.0% | $900,000 | $981,000 | $81,000 |
2025 | 10.0% | $981,000 | $1,079,000 | $98,000 |
2026 | 6.0% | $1,079,000 | $1,143,000 | $64,000 |
Weekly Cost (2025): $1,885
4. Western Australia (WA)
Year | Growth | Median Start | Median End | Annual $ Growth |
2024 | 9.5% | $750,000 | $821,000 | $71,000 |
2025 | 9.0% | $821,000 | $895,000 | $74,000 |
2026 | 5.0% | $895,000 | $940,000 | $45,000 |
Weekly Cost (2025): $1,423
5. South Australia (SA)
Year | Growth | Median Start | Median End | Annual $ Growth |
2024 | 6.5% | $800,000 | $852,000 | $52,000 |
2025 | 6.0% | $852,000 | $903,000 | $51,000 |
2026 | 5.0% | $903,000 | $948,000 | $45,000 |
Weekly Cost (2025): $981
6. Tasmania (TAS)
Weekly Cost (2025): ~$300
7. ACT
Weekly Cost (2025): ~$600
8. Northern Territory (NT)
Weekly Cost (2025): ~$700+ (high volatility, high yield)
Cost of Indecision Model
Example: Queensland (High Growth Market)
Annual Growth (2025): $98,000
Delay Period | Missed Growth | Weekly Cost |
3 Months | $24,500 | $1,885 |
6 Months | $49,000 | $1,885 |
12 Months | $98,000 | $1,885 |
Compounding Impact (2024 → 2026)
Scenario: Investor waits 2 years
Queensland Example:
2024 Growth: $81,000
2025 Growth: $98,000
2026 Growth: $64,000
Total Missed Growth:👉 $243,000
Financial Impact:
Entry Price Increase: +27%
Additional Deposit (20%):
👉 $48,600 extra required
Larger Mortgage:👉 +$194,000 additional debt

State Ranking – Cost of Indecision
Rank State Weekly Cost
1 QLD ~$1,885
2 WA ~$1,423
3 NSW ~$1,077
4 SA ~$981
5 VIC ~$558
6 ACT ~$600
7 NT ~$700
8 TAS ~$300
Market Drivers (Why This Is Happening)
1. Supply Constraints
Construction below decade averages (~15% shortfall)
Builder margins compressed → fewer completions
2. Population Growth
Strong migration into QLD, WA
Internal migration shifting demand
3. Rental Pressure
Vacancy rates near historic lows (~1–2%)
Investors re-entering market
4. Interest Rates
Cuts triggered demand surge (2025)
Borrowing capacity gains already absorbed by price growth
5. Government Policy
5% deposit schemes injecting new buyer demand instantly
Charts & Visualisation Guide
Charts & Visualisation Guide
1. Line Chart (Per State)
X-axis: Years (2024, 2025, 2026)
Y-axis: Median Price ($) Show compounding growth curve
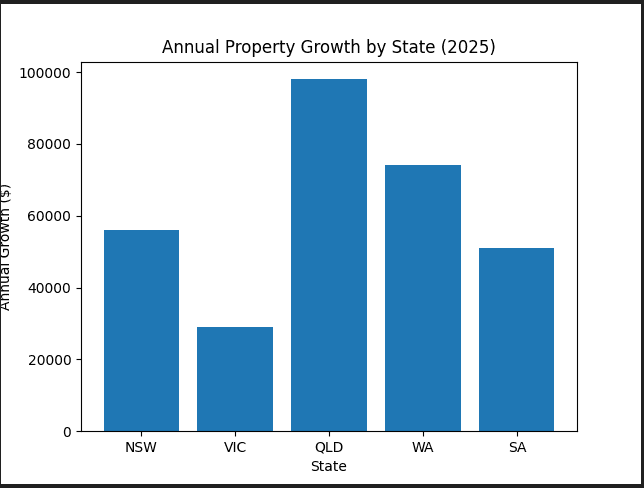
2. Bar Chart
X-axis: States
Y-axis: Annual Growth ($) Compare growth acceleration

3. Heatmap
Colour scale: Weekly Cost of Delay
Lightest = highest cost (QLD, WA)

Key Insights for Investors
Waiting for rate cuts is backward-looking behaviour
Demand shocks (policy + migration) drive faster price movement than rates
Growth compounds — missing Year 1 impacts Year 2 & 3
The market rewards time in the market, not timing the market
Risks & Assumptions
Data Sources:
CoreLogic (Cotality)
Domain forecasts
ABS housing data
RBA trends
Forecast Methodology:
Trend extrapolation + supply/demand imbalance
Adjusted for moderating growth cycle
Confidence Level:
Medium–High (macro trends strong, short-term volatility possible)
Risks:
Interest rate shocks
Credit tightening (APRA intervention)
Policy changes
Construction supply recovery (unlikely short term)
Final Takeaway
The data is clear:
👉 Indecision is costing investors thousands per month 👉 Growth is outpacing affordability improvements 👉 The longer you wait, the harder it becomes to enter
This is no longer about “if” the market moves —it’s about how much it moves without you.
With the right timing, great opportunities are within reach.
Do you have any questions? Call us at:
+61 407 465 850 | +61 482 080 189


Comments